The beautiful game has always been a blend of art and science. For decades, fans, pundits, and bettors relied on the “eye test”—a subjective evaluation of how a team played, who looked sharp, and which squad had the most passion. But in the modern era, passion and intuition are no longer enough. If you want to consistently succeed in the world of Football Predictions & Daily Match Analysis, you need to speak the language of data. Learn the best info about Banker of the day.
Whether you are a casual fan looking to win your weekend accumulator, a fantasy football manager seeking an edge, or a serious bettor aiming for long-term profitability, relying on numbers provides a tangible, objective foundation. The intersection of mathematics, tactical understanding, and market awareness is where true value lies.
In this comprehensive guide, we will break down the mechanics of modern sports analysis, explore the mathematical models behind the odds, and provide you with a robust framework to enhance your daily forecasting.
The Evolution of Football Predictions
Before we dive into formulas and betting markets, it is crucial to understand how the landscape of forecasting has transformed. Football is a notoriously low-scoring game, which makes it highly susceptible to variance and luck. A team can dominate possession, register twenty shots, and still lose 1-0 to a deflected goal in the 90th minute. This inherent unpredictability is exactly why data is so vital.
Statistical Models vs Expert Intuition
For a long time, the debate in football forecasting centered around statistical models vs expert intuition. Traditionalists argued that football is too fluid to be captured by numbers. They believed that a seasoned scout or a former player could see things a spreadsheet never could—like a player’s body language, the shifting momentum of a crowd, or the sheer willpower of a captain.
However, human intuition is heavily flawed. We are prone to cognitive biases. We remember the spectacular 30-yard strikes but forget the 15 times that same player gave the ball away. We overvalue recent performances and undervalue long-term trends.
Statistical models, on the other hand, do not have a favorite team. They do not care about narratives. They process thousands of data points to reveal the underlying reality of a team’s performance. Today, the most successful approach combines the two: using advanced data to form a baseline, and applying expert, context-driven intuition to adjust for variables that algorithms might miss.
Core Metrics: The Foundation of Data-Driven Forecasting
To make accurate football predictions, you must move beyond basic statistics like possession percentages and total shots. While these numbers provide a snapshot of a game, they lack context. Modern sports analysis demands a deeper look at underlying performance indicators.
Tracking Team Performance Metrics
Consistently tracking team performance metrics allows you to see the “true” strength of a squad, cutting through the noise of lucky wins or unlucky defeats. Some of the most critical metrics include:
- Shots in the Box: Shots taken closer to the goal are infinitely more valuable than speculative long-range efforts.
- Passes Per Defensive Action (PPDA): A metric used to measure pressing intensity. A lower PPDA means a team presses high and aggressively, which can disrupt build-up play.
- Deep Completions: Successful passes completed within 20 yards of the opponent’s goal. This indicates sustained offensive pressure.
- Field Tilt: A measure of territorial dominance, calculated by looking at a team’s share of final-third passes compared to their opponent.
Deep Dive: How to Calculate Expected Goals (xG)
No metric has revolutionized football analysis quite like Expected Goals (xG). But what exactly is it, and how does it work?
Expected Goals measures the quality of a scoring chance. It assigns a decimal value between 0.00 and 1.00 to every shot taken, representing the probability that the specific shot will result in a goal. A penalty kick, for instance, has an xG of roughly 0.79, meaning it is scored 79% of the time. A shot from the halfway line might have an xG of 0.01.
Understanding how to calculate expected goals xG requires looking at the historical data of thousands of similar shots. When data providers like Opta or StatsBomb assign an xG value, their algorithms consider multiple variables:
- Distance to Goal: Naturally, the closer the shooter, the higher the probability.
- Angle to Goal: A shot from the center of the penalty area is much easier than a shot from a tight angle near the goal line.
- Body Part: Was the shot taken with the player’s dominant foot, weaker foot, or head? (Headers generally have a lower xG than shots with the feet from the same distance).
- Type of Assist: Was it a through ball, a cross, a cutback, or a set-piece? Cutbacks, for example, heavily increase the chance of a goal because they force the goalkeeper to shift their position.
- Game Situation: Was it an open play, a direct free kick, or a counter-attack?
- Defensive Pressure: How many defenders were between the shooter and the goal? Was the goalkeeper in a good position?
By summing up a team’s xG over a match, you can see how many goals they “should” have scored based on chance quality. If Team A beats Team B 2-0, but the xG was 0.5 to 2.3, the data tells us that Team B actually created much better chances and was incredibly unlucky. Over a 38-game season, teams almost always regress to their underlying xG numbers.
How Are Win Probabilities Calculated?
When you look at a sophisticated match preview, you will often see percentages assigned to a Home Win, Draw, or Away Win. But how are win probabilities calculated?
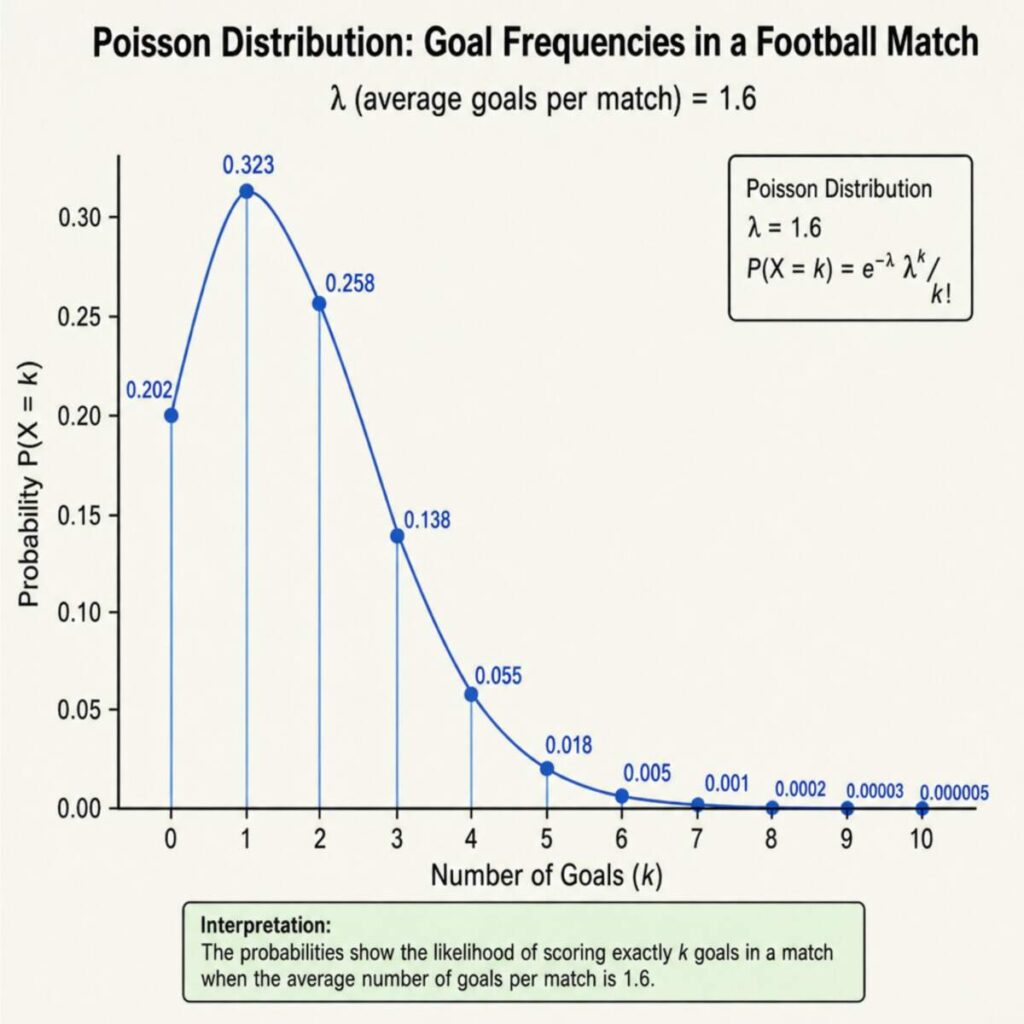
Most professional syndicates and bookmakers use a variation of the Poisson Distribution combined with advanced rating systems like the Elo Rating System.
The Poisson distribution is a mathematical concept used to calculate the likelihood of a certain number of events happening in a fixed interval of time. In football, that “event” is a goal. To use this model, you calculate a team’s Attack Strength and Defense Strength relative to the league average.
For example, if you know the home team is expected to score 1.8 goals based on their attack strength and the away team’s defensive weakness, and the away team is expected to score 1.2 goals, you can run these numbers through a Poisson formula. The output will give you the exact percentage chance of every possible scoreline (1-0, 1-1, 2-1, 0-0, etc.). By summing the probabilities of all home win scorelines, all draw scorelines, and all away win scorelines, you arrive at your final win probabilities.
A Step-by-Step Soccer Match Preview Methodology
Data is only useful if you have a structured way to apply it. To avoid feeling overwhelmed by the sheer volume of statistics available, you need a repeatable process. Here is a comprehensive, step-by-step soccer match preview methodology to guide your daily analysis.
Step 1: Analyzing Head-to-Head Historical Data
Start by looking at the recent history between the two clubs. While a match played five years ago has little bearing on today, analyzing head-to-head historical data from the last two to three seasons can reveal fascinating tactical stalemates or psychological edges.
Does a particular high-pressing team always struggle against a specific counter-attacking opponent? Are there certain “bogey teams” that a top-tier club routinely drops points against, despite dominating the underlying metrics? Look for stylistic clashes that repeat themselves in the data.
Step 2: Interpreting Tactical Line-Ups and Formations
A team’s shape dictates the flow of the game. Interpreting tactical line-ups and formations is a critical skill for any forecaster. You cannot just look at the starting XI names; you must understand how they operate in a system.
- Width vs. Narrowness: If a team plays a narrow 4-2-2-2 (like RB Leipzig historically), they congest the middle. If their opponent plays a 4-3-3 with high-flying wingers, the game will likely be decided by whether the wingers can exploit the space out wide before the narrow team overloads the midfield.
- High Line vs. Low Block: A team playing a high defensive line to trap opponents offside is incredibly vulnerable to pace. If you notice a team deploying a high line against an opponent with lightning-fast forwards who specialize in timing runs behind the defense, you have identified a massive tactical mismatch.
Step 3: Assessing the Impact of Player Injuries on Match Outcomes
Not all injuries are created equal. A missing backup left-back might not move the needle, but losing a pivotal defensive midfielder or a star playmaker completely alters a team’s win probability.
When evaluating the impact of player injuries on match outcomes, look at the “Drop-off Rate.” This is the statistical difference in performance between the starter and their replacement. If a team’s starting center-back wins 75% of his aerial duels and his replacement only wins 50%, the team is suddenly highly vulnerable to crosses and set-pieces. Always check the official injury reports and press conferences the day before the match.
Step 4: The Importance of Squad Rotation in Busy Schedules
Modern football calendars are incredibly demanding. Top clubs are often fighting on multiple fronts: domestic leagues, domestic cups, and European competitions like the Champions League.
Understanding the importance of squad rotation in busy schedules is crucial. If a team played a grueling 120-minute cup fixture on a Thursday night in Eastern Europe, their energy levels for a Sunday afternoon league game will be severely depleted. Managers will often rotate their squads, resting key players.
When a manager rests two key attackers and a central midfielder, the team’s expected goals output drops significantly. Identifying matches where a favorite might deploy a rotated squad is one of the most profitable angles in match analysis.
Contextual Factors That Tip the Scales
Data provides the baseline, and tactical matchups provide the narrative, but contextual factors often decide the final outcome.
Factors Affecting Home Field Advantage
Home field advantage is a globally recognized phenomenon in sports, but it is not a static number. In the Premier League, home advantage is typically worth around +0.3 to +0.5 goals per game, but this varies wildly depending on the specific circumstances.
Several factors affecting home field advantage must be considered:
- Crowd Influence on Referees: Studies have shown that loud, hostile crowds unconsciously bias referees toward the home team, leading to fewer yellow cards for home players and more favorable foul calls.
- Travel Fatigue: A domestic away game an hour down the road is vastly different from a transcontinental flight for a midweek continental tie.
- Pitch Dimensions and Surface: Not all pitches are the same size. A team that relies on expansive, wide passing will struggle on a tightly packed, narrow pitch. Furthermore, artificial turf or poorly maintained grass can neutralize a technically superior passing team.
- Altitude and Climate: In South American football (CONMEBOL), teams traveling to play in the high altitudes of Bolivia or Ecuador face severe physical disadvantages, significantly boosting the home side’s edge.
Weather, Motivation, and Match Context
Never underestimate the elements. Heavy rain and waterlogged pitches slow down passing sequences, often favoring physical, defensive-minded teams and leading to lower-scoring games (unders).
Motivation is another massive variable. At the end of the season, a mid-table team with nothing to play for will often perform well below their statistical baseline when facing a team fighting desperately against relegation. Always ask yourself: Who needs this win more?
Translating Analysis into Betting Strategy
You can be the greatest tactical analyst in the world, but if you do not understand how markets operate, you will struggle to profit from your knowledge. Successful football forecasting ultimately comes down to understanding the math behind the money.
Demystifying Betting Odds
At their core, betting odds are simply a reflection of implied probability. Bookmakers use odds to represent how likely they believe an event is to occur, while also baking in their profit margin (known as the “vig” or “overround”).
To convert European decimal odds into implied probability, you use a simple formula: 1 / Decimal Odds * 100 = Implied Probability %
For example, if a team has odds of 2.50 to win: 1 / 2.50 = 0.40 * 100 = 40% implied probability.
Identifying Value in Betting Markets
The golden rule of sports forecasting is that you are not just trying to predict winners; you are looking for situations where the bookmaker’s odds are wrong. This is known as identifying value in betting markets.
Let us say your personal statistical model, which factors in xG, squad rotation, and tactical matchups, determines that Team A has a 50% chance of winning the match. A 50% chance equates to true odds of 2.00 (1 / 0.50).
If you check the bookmaker and they are offering odds of 2.20 for Team A to win, the bookmaker is implying only a 45.4% chance of victory. Because your model says the actual probability (50%) is higher than the implied probability (45.4%), this is a Value Bet (+EV, or Positive Expected Value).
Over a sample size of hundreds of bets, consistently wagering on value is the only mathematical way to beat the bookmakers. It is not about winning every bet; it is about taking odds that are better than the mathematical reality of the event.
Understanding Asian Handicap Markets
For serious analysts, the standard 1X2 (Win/Draw/Win) market is often insufficient. It includes the draw, which is incredibly difficult to predict and eats into profit margins. Enter the Asian Handicap.
Understanding Asian handicap markets is essential for modern bettors. This market eliminates the possibility of a draw by giving a virtual head start (or deficit) to a team. It levels the playing field when a dominant team plays a weaker side.
Here is a quick breakdown of common Asian Handicap (AH) lines:
- AH 0.0 (Draw No Bet): If your team wins, you win. If it is a draw, your stake is fully refunded.
- AH -0.5: Your team must win the match for your bet to win. (Identical to a standard win bet).
- AH -0.25 (or -0.0, -0.5): Your stake is split into two halves. Half goes on AH 0.0, half on AH -0.5. If your team wins, both halves win. If they draw, half your stake is refunded, and the other half loses.
- AH -1.0: Your team must win by 2 or more goals for a full payout. If they win by exactly 1 goal, your entire stake is refunded.
- AH +1.5: You are betting on the underdog. You win if they win, draw, or lose by exactly 1 goal.
Asian handicaps offer better value, lower bookmaker margins, and a safety net that traditional betting markets lack. By applying your expected goals data to handicap lines, you can find incredibly profitable angles—especially when backing underdogs who have strong underlying defensive metrics but struggle to score.
How to Read Bookmaker Odds Movements
The betting market is dynamic. Odds are not static; they fluctuate from the moment they are released (opening line) to the moment the match kicks off (closing line). Learning how to read bookmaker odds movements provides a window into where the “smart money” is going.
When bookmakers release opening lines, they are essentially taking a guess based on their initial models. As professional syndicates and high-rollers (sharp bettors) begin placing large wagers, the bookmakers adjust the odds to balance their liability and minimize risk.
If a team opens at 2.50 on Monday and the odds drop to 2.10 by Friday without any major injury news, this is a clear sign of “sharp money” backing that team. The market is correcting itself. Tracking these line movements helps you validate your own models. If your model agrees with the sharp money, you are on the right track. If it wildly disagrees, you need to double-check your variables to ensure you haven’t missed a crucial piece of information.
Tools and Resources for the Serious Analyst
You cannot build a house without tools, and you cannot build a reliable football prediction model without high-quality data. Thankfully, the democratization of football statistics means you no longer need to be a billionaire club owner to access elite analytics.
Best Data Sources for Sports Modeling
Finding the right data is half the battle. Here are some of the best data sources for sports modeling available today:
- FBref (Powered by Opta): The absolute gold standard for free, accessible football data. FBref offers incredibly granular statistics, including xG, expected assists (xA), shot-creating actions, pressing data, and progressive passes for dozens of leagues worldwide.
- Understat: A fantastic resource specifically for Expected Goals data across Europe’s top five leagues. They provide excellent visualization tools, shot maps, and xG philosophy timelines to track a team’s performance over the season.
- StatsBomb: While their premium tier is strictly for professional clubs and syndicates, StatsBomb frequently releases free datasets for major tournaments and offers incredible insights into advanced tactical metrics via their public articles and podcasts.
- SofaScore / FotMob: Excellent mobile apps for tracking live scores, but more importantly, they provide player ratings, heat maps, momentum graphs, and real-time average positions during a match.
- Transfermarkt: The best database for tracking historical injury records, player transfer values, contract lengths, and referee tendencies.
Building Your Own Database
If you want to take your Football Predictions & Daily Match Analysis to the absolute highest level, you should start logging your own data. Create a spreadsheet where you track your predicted odds against the bookmaker’s closing odds. Log your perceived value, the actual result, and the match xG.
Over time, this database will highlight your strengths and weaknesses. You might discover that your model is incredibly profitable when predicting matches in the German Bundesliga, but consistently loses money when analyzing the Italian Serie A. Identifying these personal biases allows you to refine your approach.
Pitfalls to Steer Clear Of
Even armed with the best data and tactical insights, human psychology can be your own worst enemy. The path to successful forecasting is littered with cognitive traps.
Avoiding Common Forecasting Mistakes
To maintain an edge, you must be disciplined in avoiding common forecasting mistakes:
- The Gambler’s Fallacy: This is the mistaken belief that if something happens more frequently than normal during a given period, it will happen less frequently in the future. If a striker has missed his last five high-xG chances, he is not “due” a goal. Each shot is an independent event.
- Recency Bias: Placing too much emphasis on a team’s last one or two matches while ignoring their long-term data. A team might suffer a 4-0 defeat due to an early red card and a couple of fluky long-range goals. The public will overreact and assume the team is in crisis. The smart data analyst looks at the 20-game xG trend, realizes the 4-0 loss was an anomaly, and backs them to bounce back the following week at inflated odds.
- Confirmation Bias: We all have favorite teams and favorite players. Confirmation bias occurs when you subconsciously seek out data that supports your pre-existing gut feeling, while ignoring data that contradicts it. To combat this, always try to actively build a case against the bet you want to make. If your argument holds up, it is a solid prediction.
- Ignoring Variance (Small Sample Sizes): Judging a team or a player based on a three-game sample size is statistical suicide. Three games is roughly 270 minutes of football—a tiny window highly susceptible to luck. Always rely on data sets of at least 8 to 10 matches before drawing concrete conclusions about a team’s true level.
Conclusion: The Never-Ending Pursuit of the Edge
Mastering Football Predictions & Daily Match Analysis is not a destination; it is a continuous journey. The game is constantly evolving. Managers invent new tactical systems, governing bodies change the rules (like the introduction of VAR or the five-substitution rule), and betting markets grow sharper every single day.
To stay ahead, you must treat your analysis as a living, breathing process. Embrace the objective clarity of expected goals and performance metrics, but never lose sight of the human elements—the injuries, the schedules, the tactical nuances, and the roar of the home crowd.
By combining rigorous statistical models with sharp tactical intuition, practicing disciplined bankroll management, and constantly seeking value rather than just “winners,” you transform yourself from a passive spectator into an analytical forecaster. The numbers are out there, hidden in plain sight on the pitch every weekend. It is up to you to interpret them.